This job aid outlines the process for running, sorting, and filtering reports in Workday.
Run Reports
Page Loading...Checking SSO..

Important Information
Refer to the Commonly Used Report List for a list of reports that will be useful in your area.
Getting Started
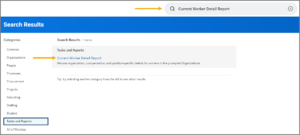
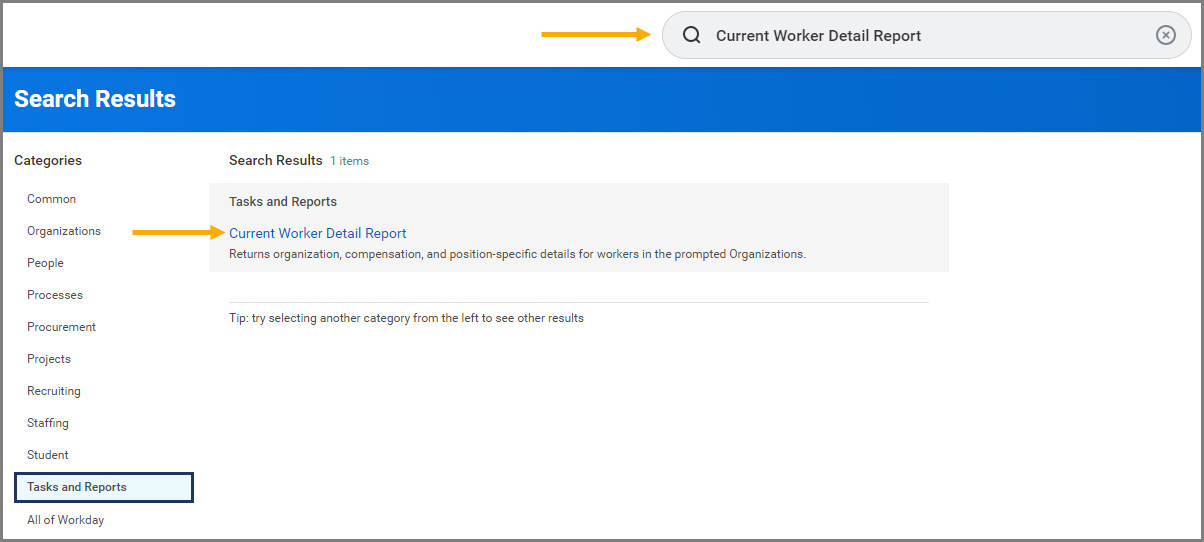
Search for a Report
- Search for the report by entering the name in the Search Bar.
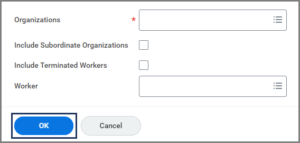
- Specific reports have prompts. For these reports, select/enter the data you want to view and select OK.

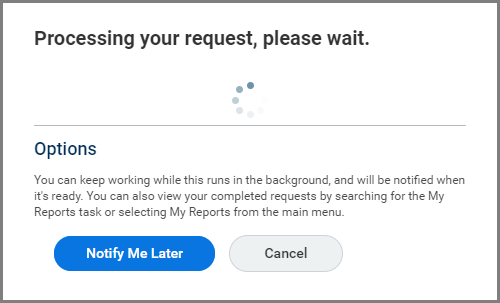
Note: Depending on the type of report and criteria selected, it may take some time to generate. You may be presented with the following window. If you select Notify Me Later, the report will run in the background and allow you to open it later once it is generated.
Sort a Report
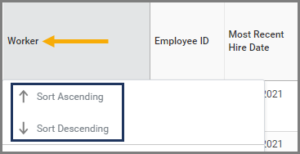
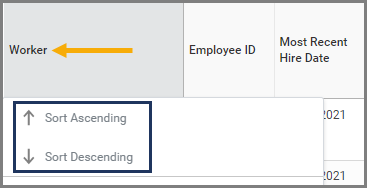
- To sort a report, select the header of any column to sort by its content alphabetically.
- Select Sort Ascending or Sort Descending (i.e., A to Z or Z to A).
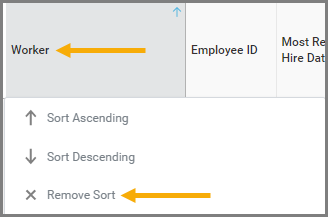
- To remove the sort order, select the same column header again, then select Remove Sort.

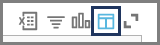
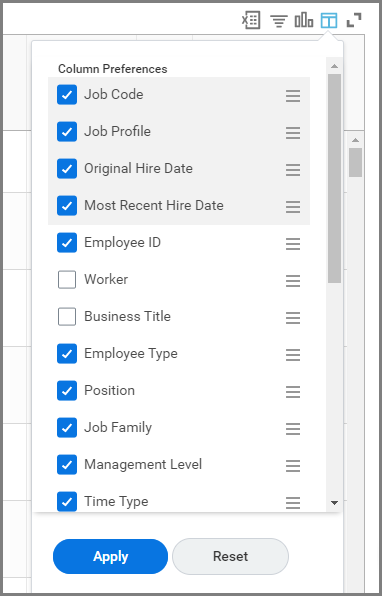
- You can also change the order of columns on a report, hide columns, and freeze columns via the Column Preferences menu. First, select the Column Preferences icon.
- You may drag and reorder a Column by selecting and then dragging it (e.g., holding the left-mouse button) up and down the list.
- You may freeze a Column by dragging it to the top of the list. This will fix the Column to the left-hand side of the report at all times. Columns set to freeze will display a gray background within this menu.
- Uncheck the blue Checkbox next to a Column to hide that column from the report.
Filter a Report
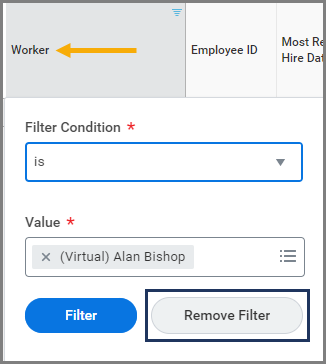
- To filter a report, first select any column header.
- Select a Filter Condition and enter a Value, depending on what you want to filter by. For example, if you wanted to filter out graduate assistants in a report, you would select not equal to in the Filter Condition field, and enter Graduate Assistant in the Value field.
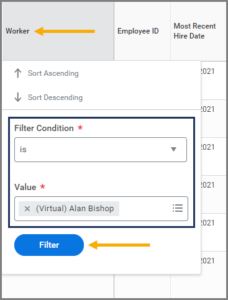
- Select Filter.
- To remove the filter, select the same column header again and then select Remove Filter.

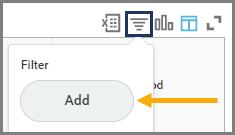
- You can also use the Filter icon to filter columns in the report. Select the Filter icon and then select Add to add a filter.
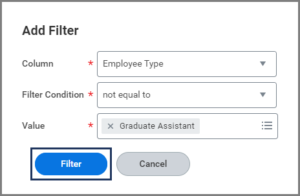
- Select the Column you wish to filter. Depending on your selection, the Filter Condition and Value fields will appear. Enter these fields as outlined above, and select Filter.

Note: You can also remove filters this way by selecting the Filter icon and then selecting the X icon next to each filter.
![]()
View Report Charts
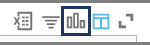
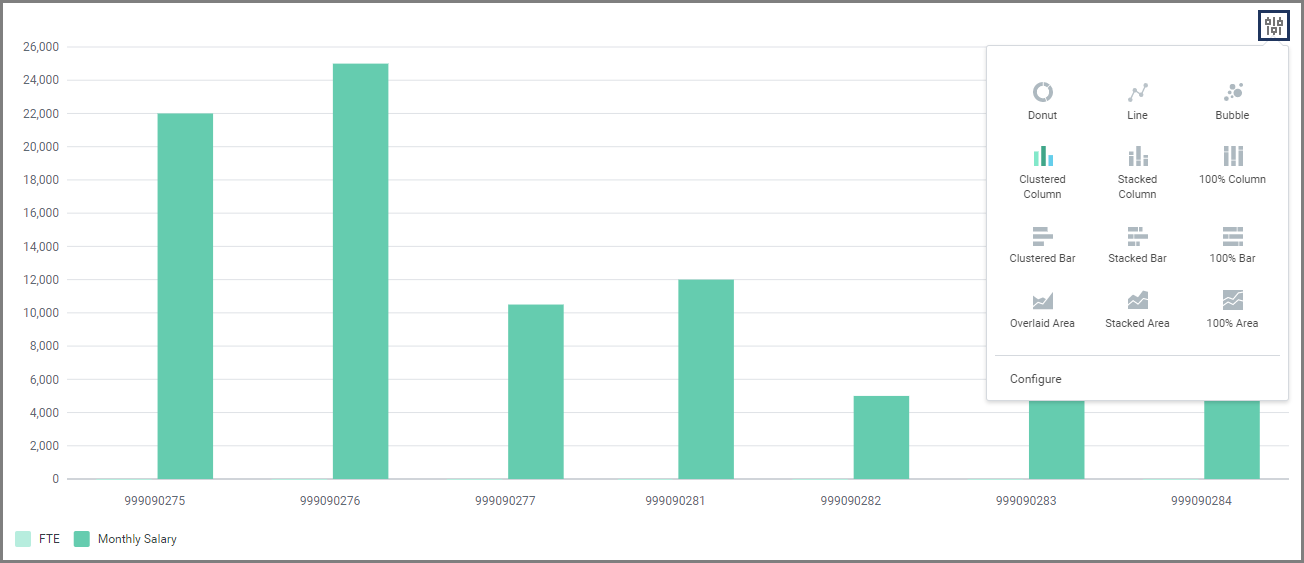
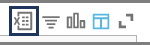
- To view the report’s data in chart format, select the Expand Chart icon.
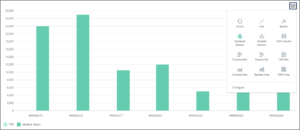
- The chart view will display at the top of the page. Select the Configure and View Chart Data icon in the upper-right corner to choose the type of chart that is displayed (e.g., donut, line, bubble).
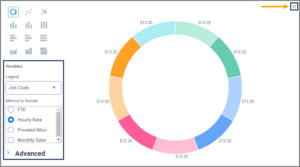
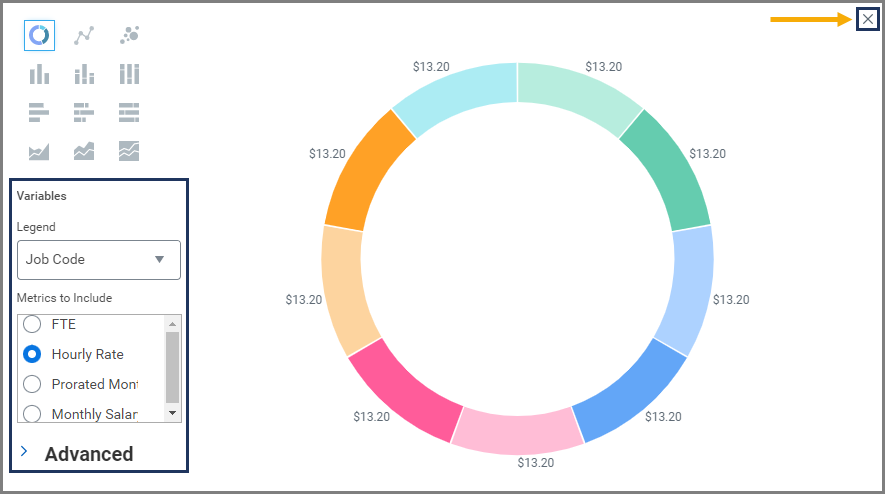
- To edit the variables of the chart, select Configure.
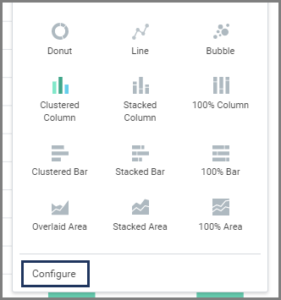
- Here, you may edit the chart’s axes, legend, metrics. Even more variables may be changed under the Advanced section. When finished, select the X icon in the top-right of the window.

Note: Select the Collapse Chart icon again to close the chart view.
Export a Report
- To export the data to a spreadsheet, select the Export to Excel icon .
- Under Export Document, select Download.
- The report will be downloaded to your computer as an XLSX file, which can be opened with Microsoft Excel.
This completes the overview of how to Run Reports in Workday.