MicroStrategy Dashboard User Reference Guide
The purpose of this reference guide is to show Dashboard Consumers how to navigate MicroStrategy effectively. This reference guide will ensure that Dashboard Consumers will maximize the use of the data and visualization tools offered by the application.
Key Points:
- Users of MicroStrategy will be referred to as Dashboard Consumers.
- MicroStrategy is not replacing the BusinessObjects application.
- A SOR form should be filled out and approved by your member’s authorized security approver to gain access to MicroStrategy. Please refer to the Approver’s List to determine your point of contact for access.
Navigation
MicroStrategy offers Dashboard Consumers multiple avenues of navigation to get to their dashboards. When Dashboard Consumers log into MicroStrategy, they will be automatically sent to their Library. The Library is the Dashboard Consumers’ homepage. You may hear the terms used interchangeably.
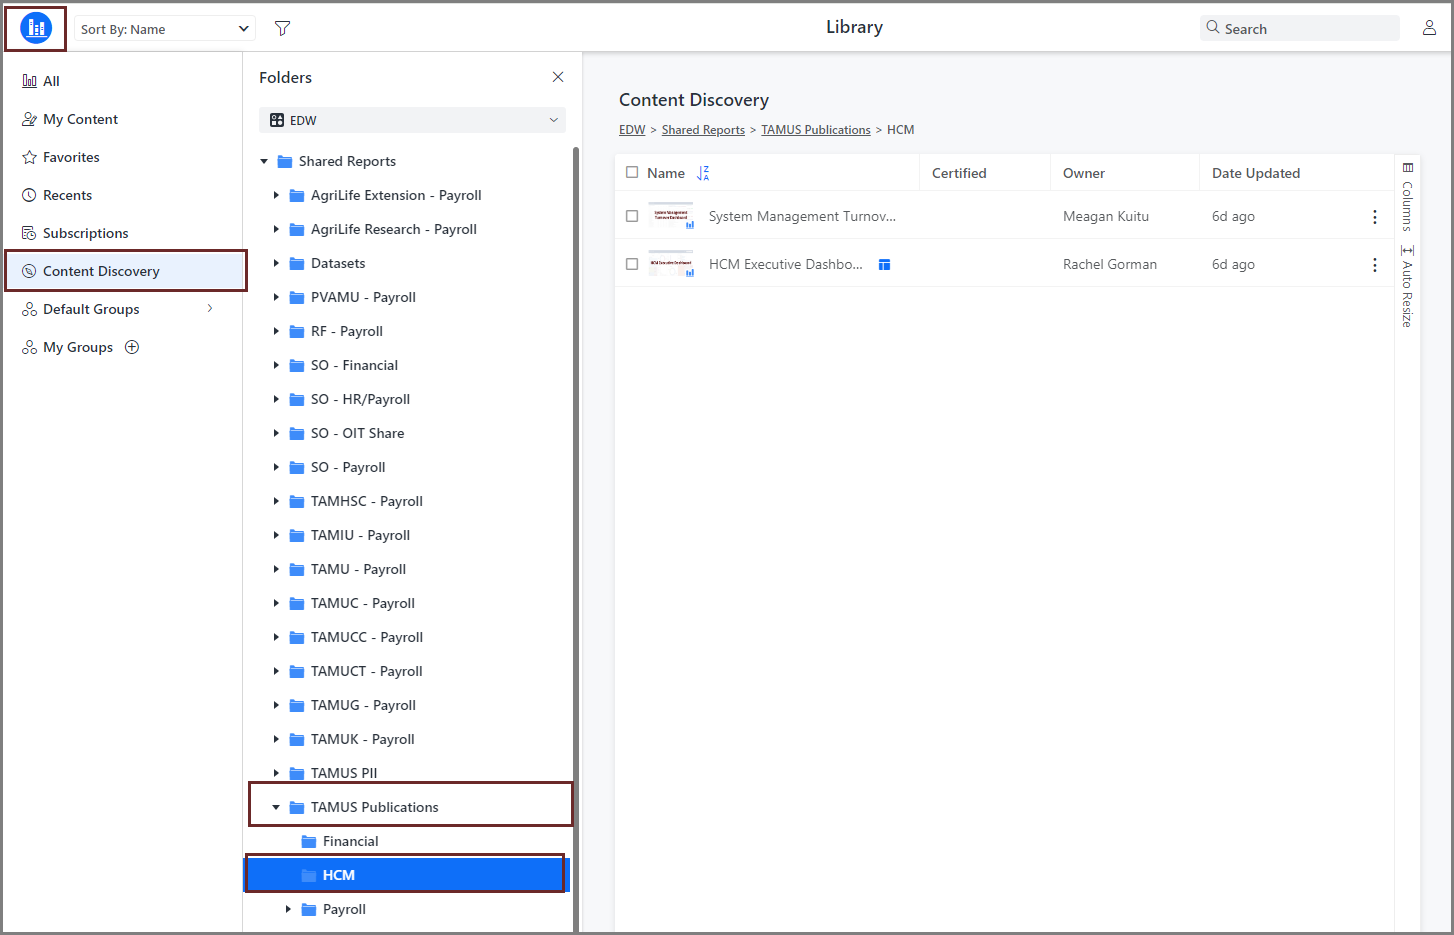
The most efficient way to navigate the application is from the Content Discovery located on the sidebar.
1. From the Library, navigate to the sidebar and select Content Discovery.
2. Select the TAMUS Publications folder.
3. Select the Financial, HCM or Payroll folder to determine the dashboard you would like to see.
From the Dashboard, navigate to the Quick Access Toolbar and select the Table of Contents then select the chapter or page you want to view. NOTE: You can also use the left and right arrow keys to navigate the different chapters and pages.
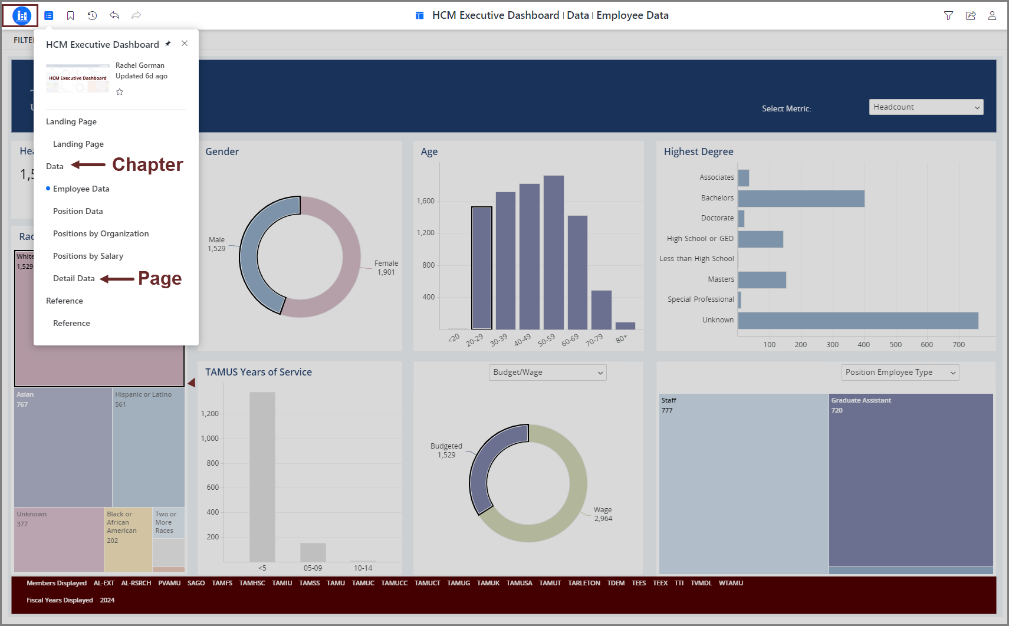
NOTE: A blue dot will appear next to the Chapter or Page you are reviewing. Any filter values you select for the Chapter will be applied to the Pages within the Chapter.
Filtering
Dashboard Consumers can use MicroStrategy data to make effective business decisions, knowing MicroStrategy uses the same trusted data from the Enterprise Data Warehouse as BusinessObjects. MicroStrategy Dashboards offer filtering options to help narrow down the information within the Chapter. Filtering in the dashboards means setting rules to display only the specific data you want to see. By applying these rules, you can narrow down large datasets to focus on relevant information, making it easier to analyze and understand the data.
Once the Dashboard Consumers enter the dashboard, they can apply the filters to the data by following the steps below:
1. From the Dashboard, navigate to the Table of Contents and select a Chapter or Page.
2. Select the Filter icon from the Quick Access Toolbar and select the Filter Data you want to apply to the Chapter.
Note: Once you select the Filter Data you want to apply, you will see the possible values associated with the selected attribute. After selecting an attribute, a Dashboard Consumer can use the search bar to also enter a specific value they would like to choose.
3. After selecting the Values for the Attribute, select the Apply button to return the desired results. Once you select the Filter Data you want to apply to the chapter, you will see the filters and your selected values displayed in the filter ribbon at the top of the dashboard.
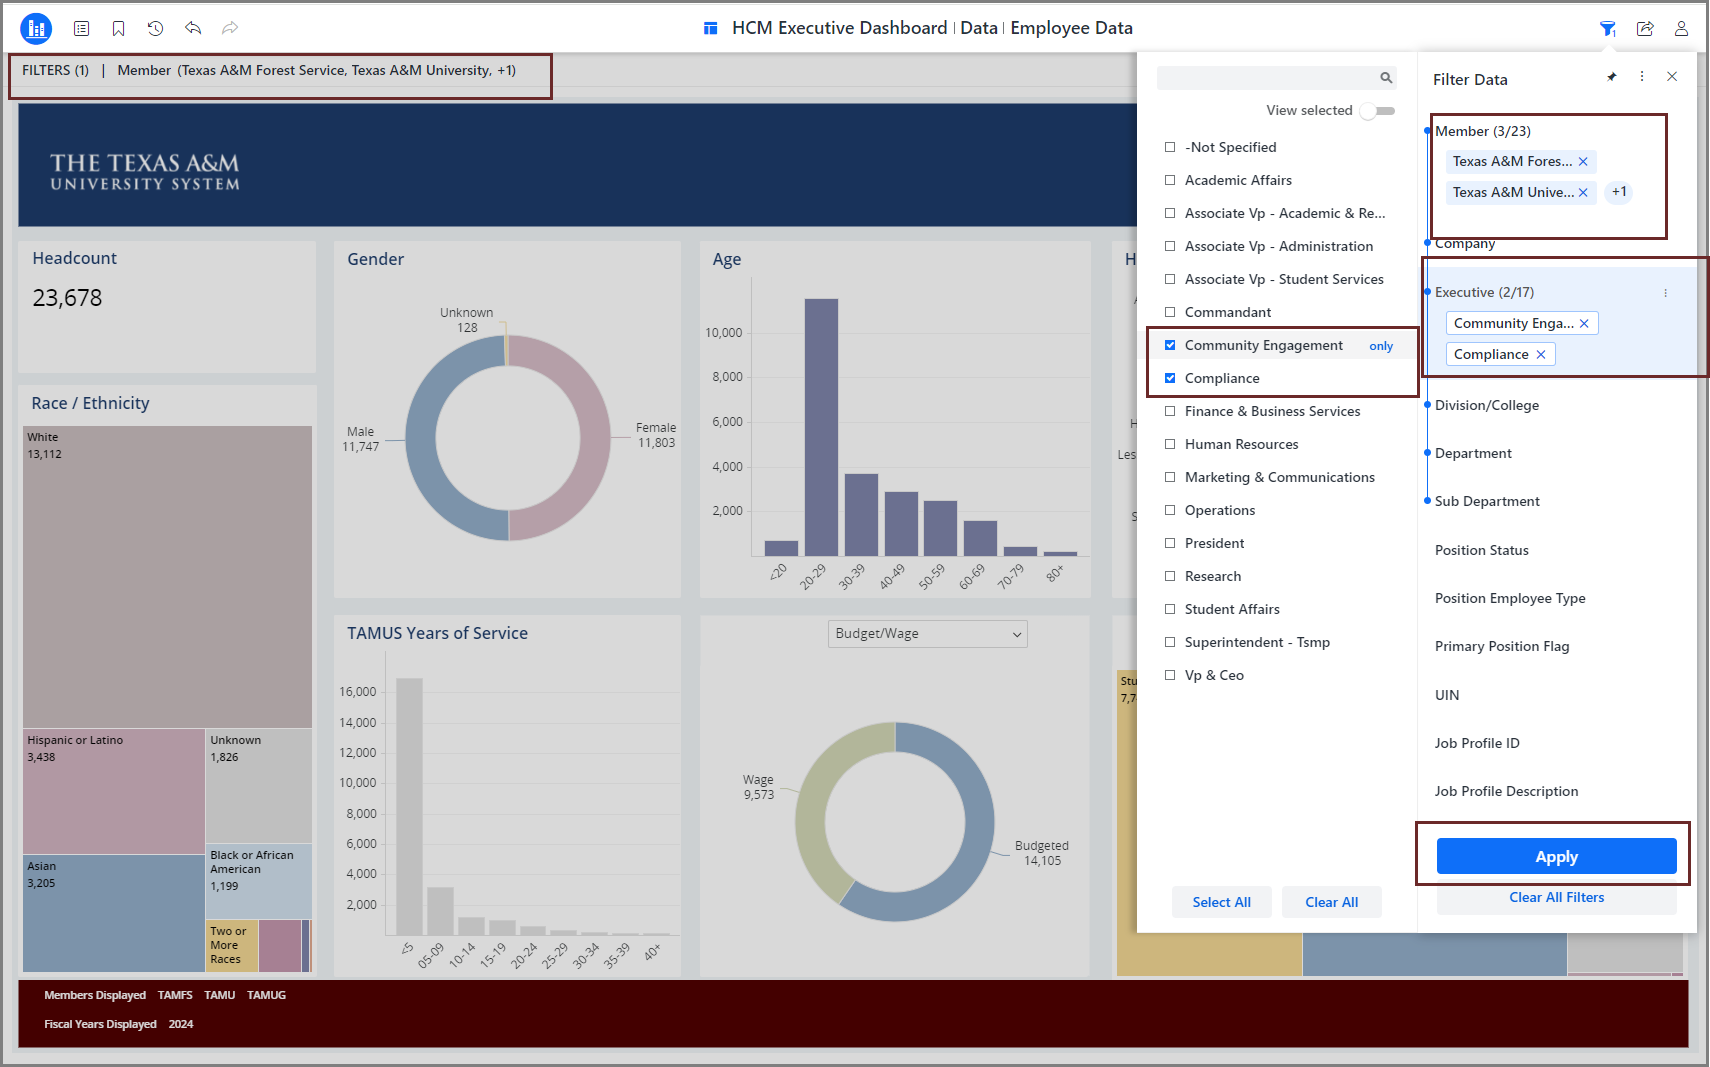
IMPORTANT: In the filter panel, the Dashboard Consumer can see all of the Values selected for an Attribute by selecting the View Selected button. By using the Select All button, Dashboard Consumers can select all of the values offered for the Attribute they have chosen. If the values the Dashboard Consumer used to filter need to be cleared, they can select the Clear All button.
Filtering by Visualization
Once the Dashboard Consumers enter the dashboard, they can apply filters by following the steps below:
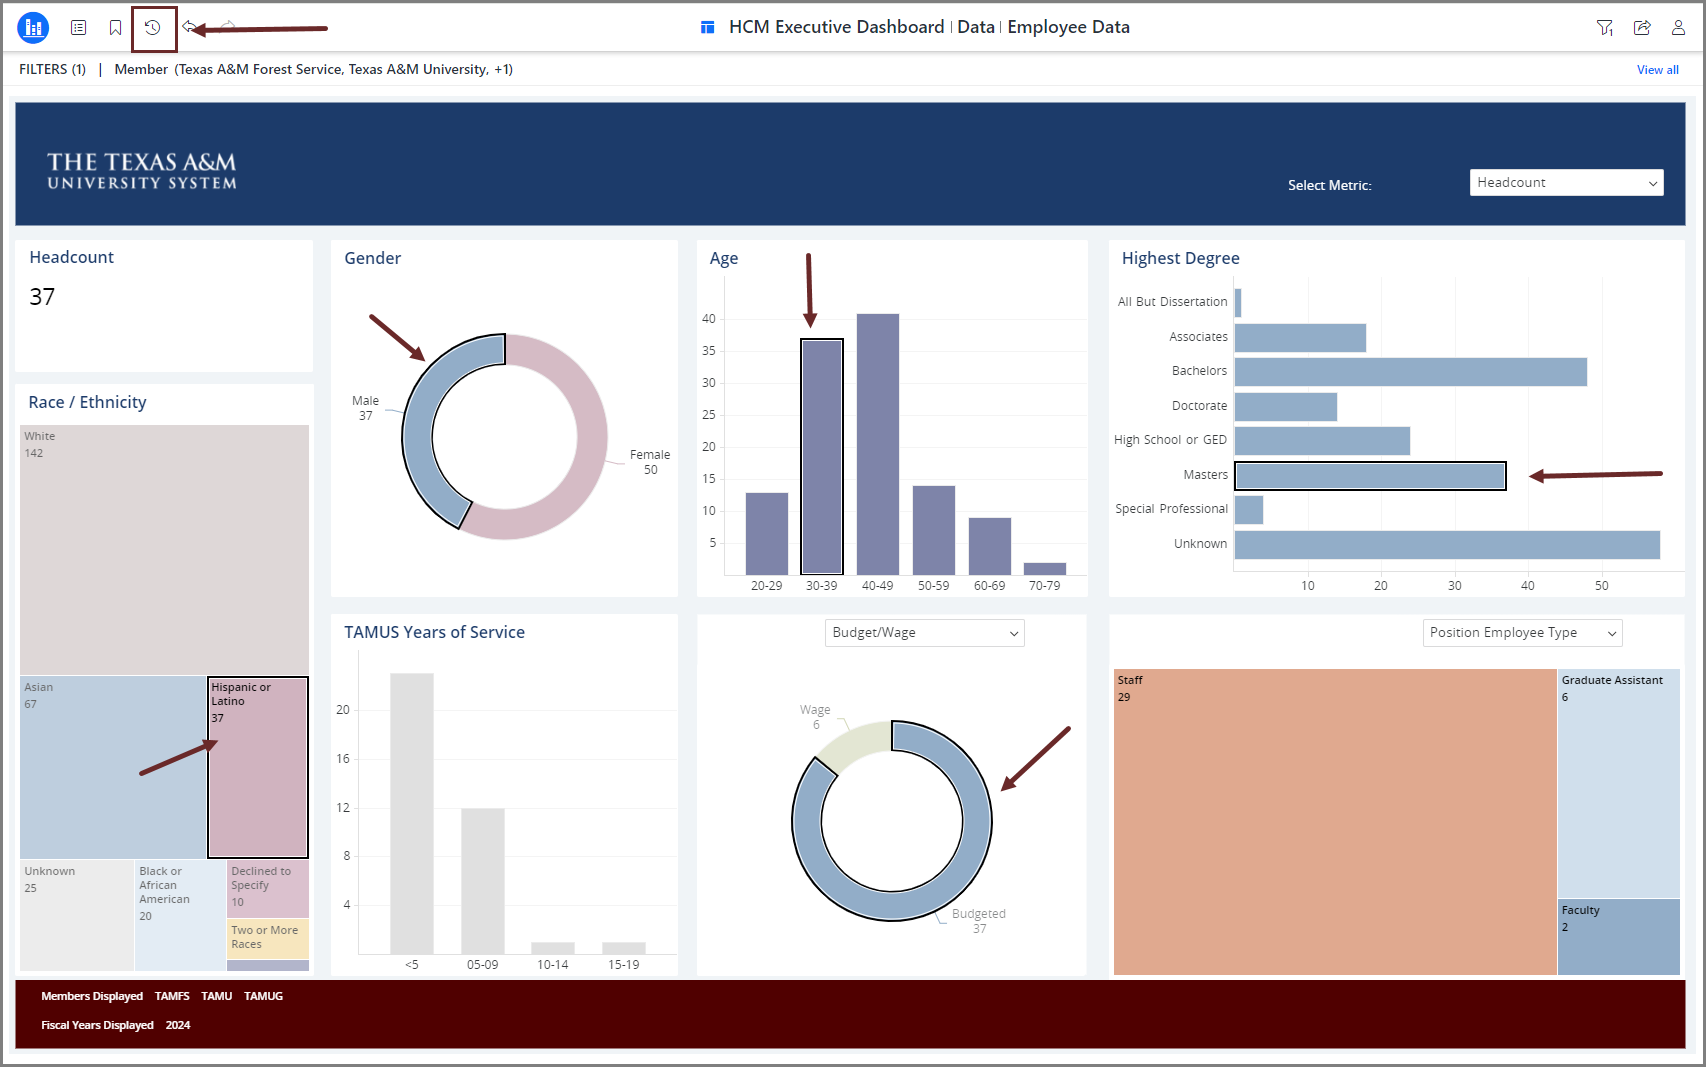
1. Navigate to the Page of the visualization that you would like to filter.
2. Once the selected page populates, you can select a section of the visualization to apply a filter to it.
Note: Selecting the CTRL button on your keyboard will allow you to select multiple sections within a visualization. This helps to apply multiple filters to the visualization.
After selecting the Values for the Attribute, MicroStrategy adds a black outline around the filtered values as an indicator that a filter is in place. To clear the filters, select a blank space in the filtered visualization.

NOTE: You can use the Reset icon to clear filter values on a dashboard. When the word Reset? Appears, select Yes. This will take you back to the landing page.
Bookmarks
Bookmarks allow Dashboard Consumers to save the view of the entire dashboard. When you select the Bookmark icon, you will save all of the filters, in-canvas selections, and prompt answers applied to the dashboard.
Once the Dashboard Consumers decide to create a bookmark, they can create a bookmark by following the steps below:
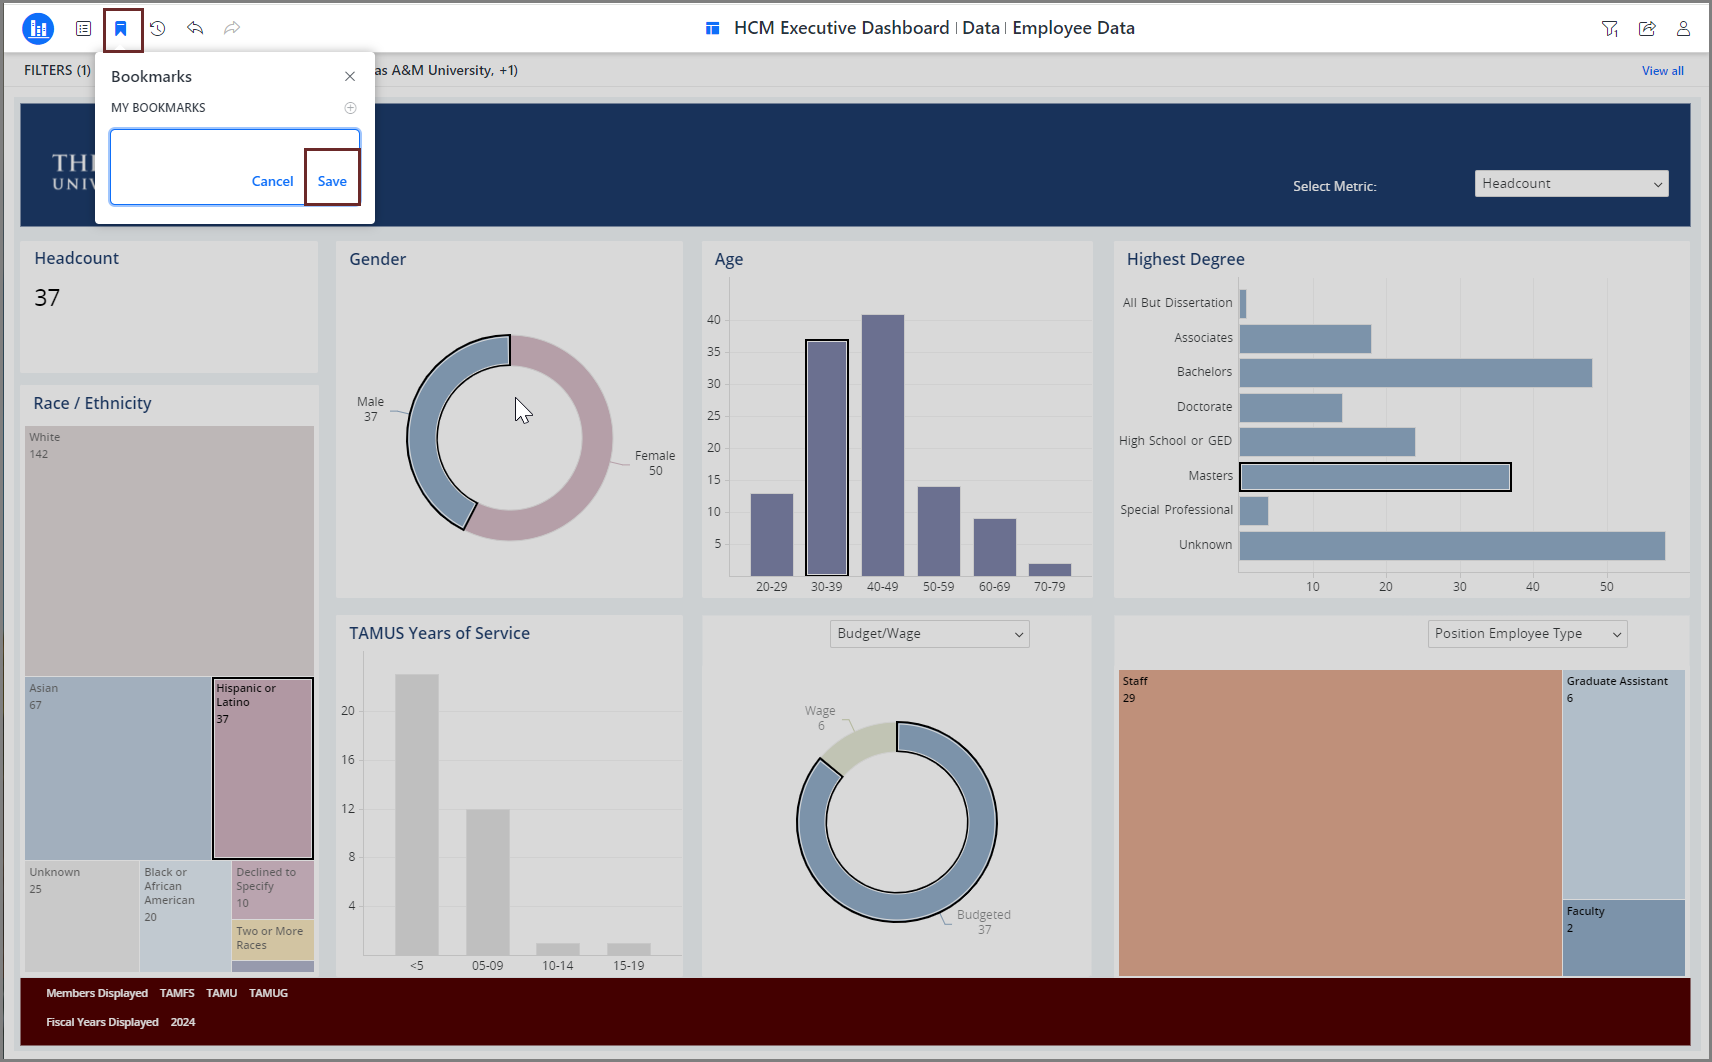
1. Select the Bookmark icon and select the Add New button.
2. Enter the name of the bookmark and select Save.
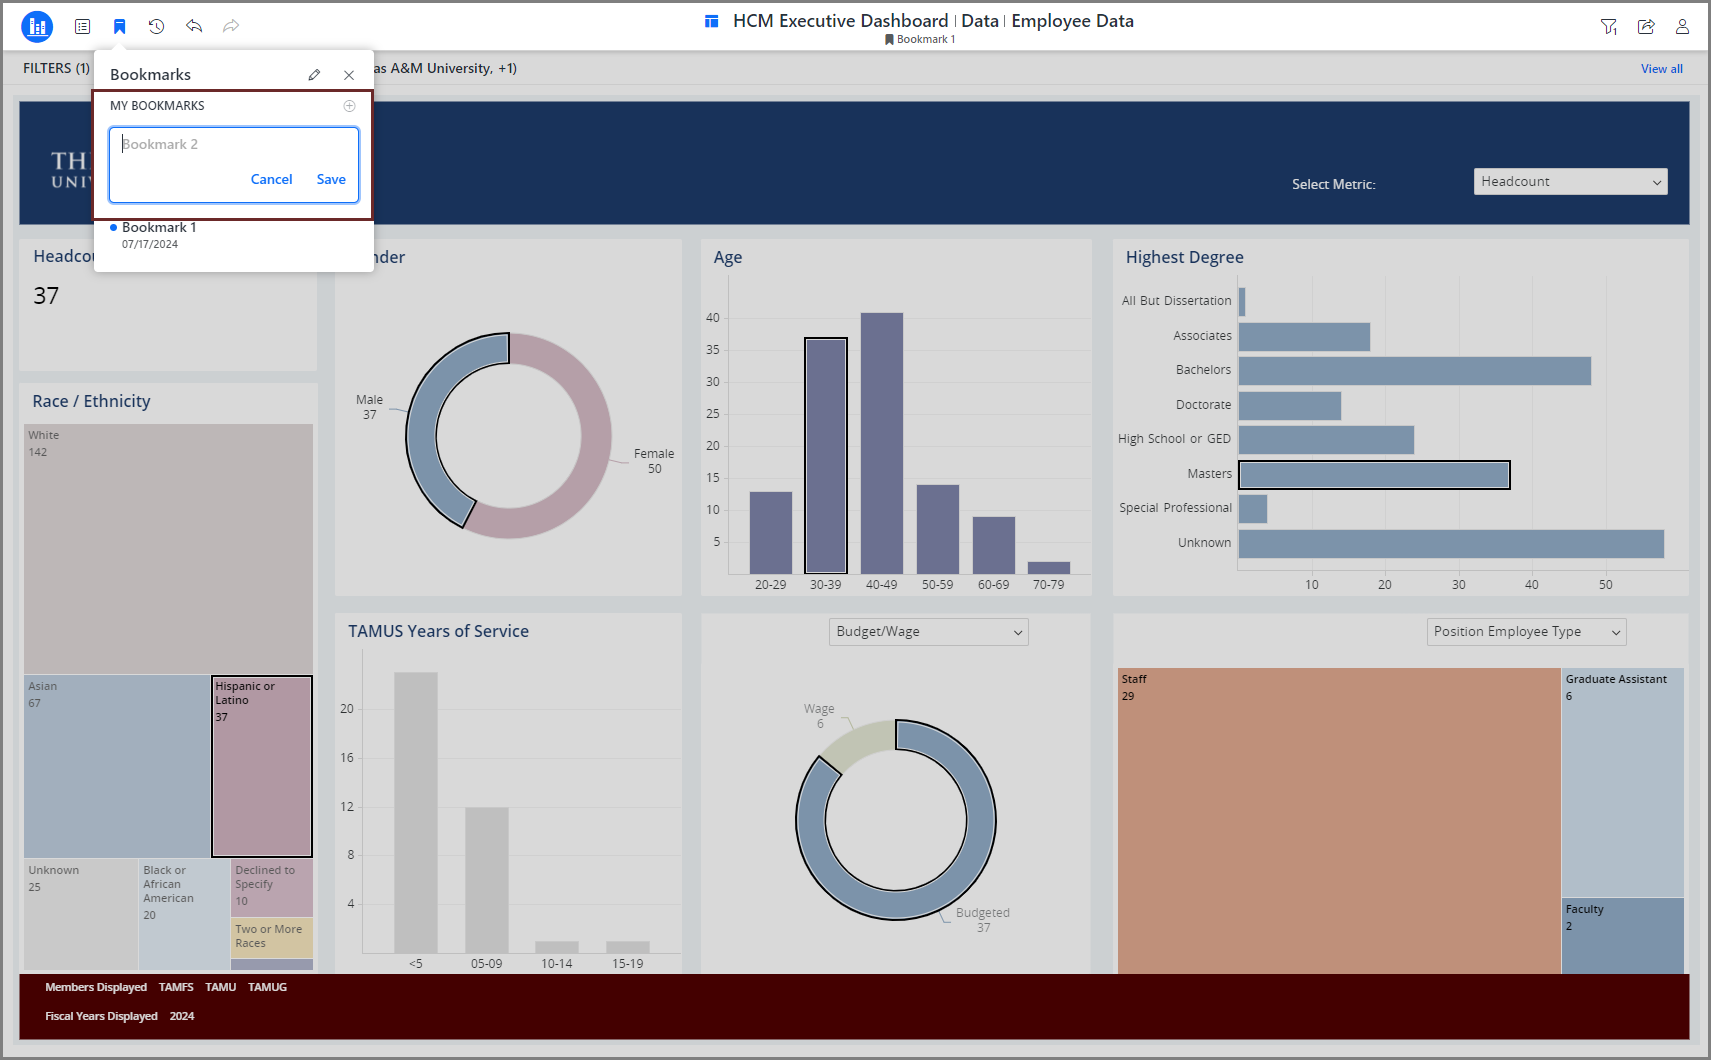
3. If you need to create another bookmark for the same Dashboard, you will need to navigate back to the Bookmark icon and select the plus sign button. Afterwards enter the name of the bookmark and select Save.
Sharing and Exporting Dashboards
MicroStrategy has various ways to share dashboards with other Dashboard Consumers or recipients by utilizing the Share icon.
Share Dashboard
Share Dashboard is a way to share the dashboard you are reviewing with other Dashboard Consumers or recipients from the Library.
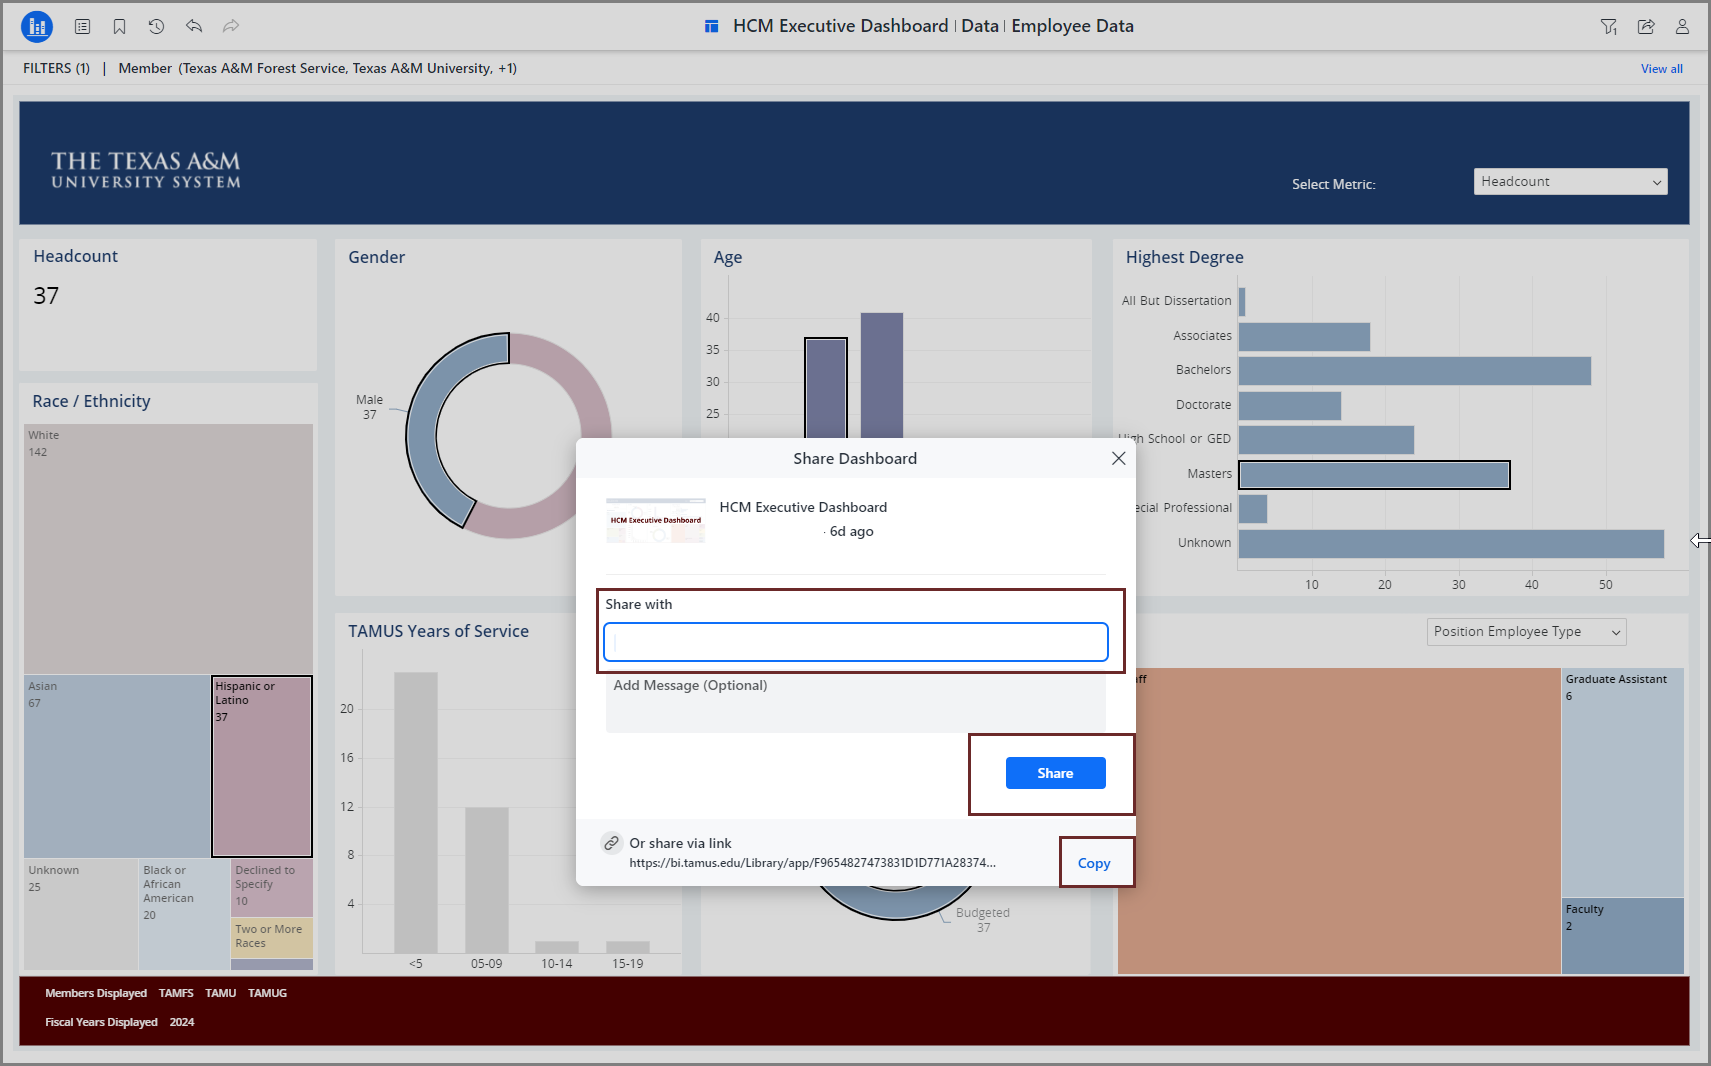
Note: You can also share the dashboard by copying the link generated when you select the share button.
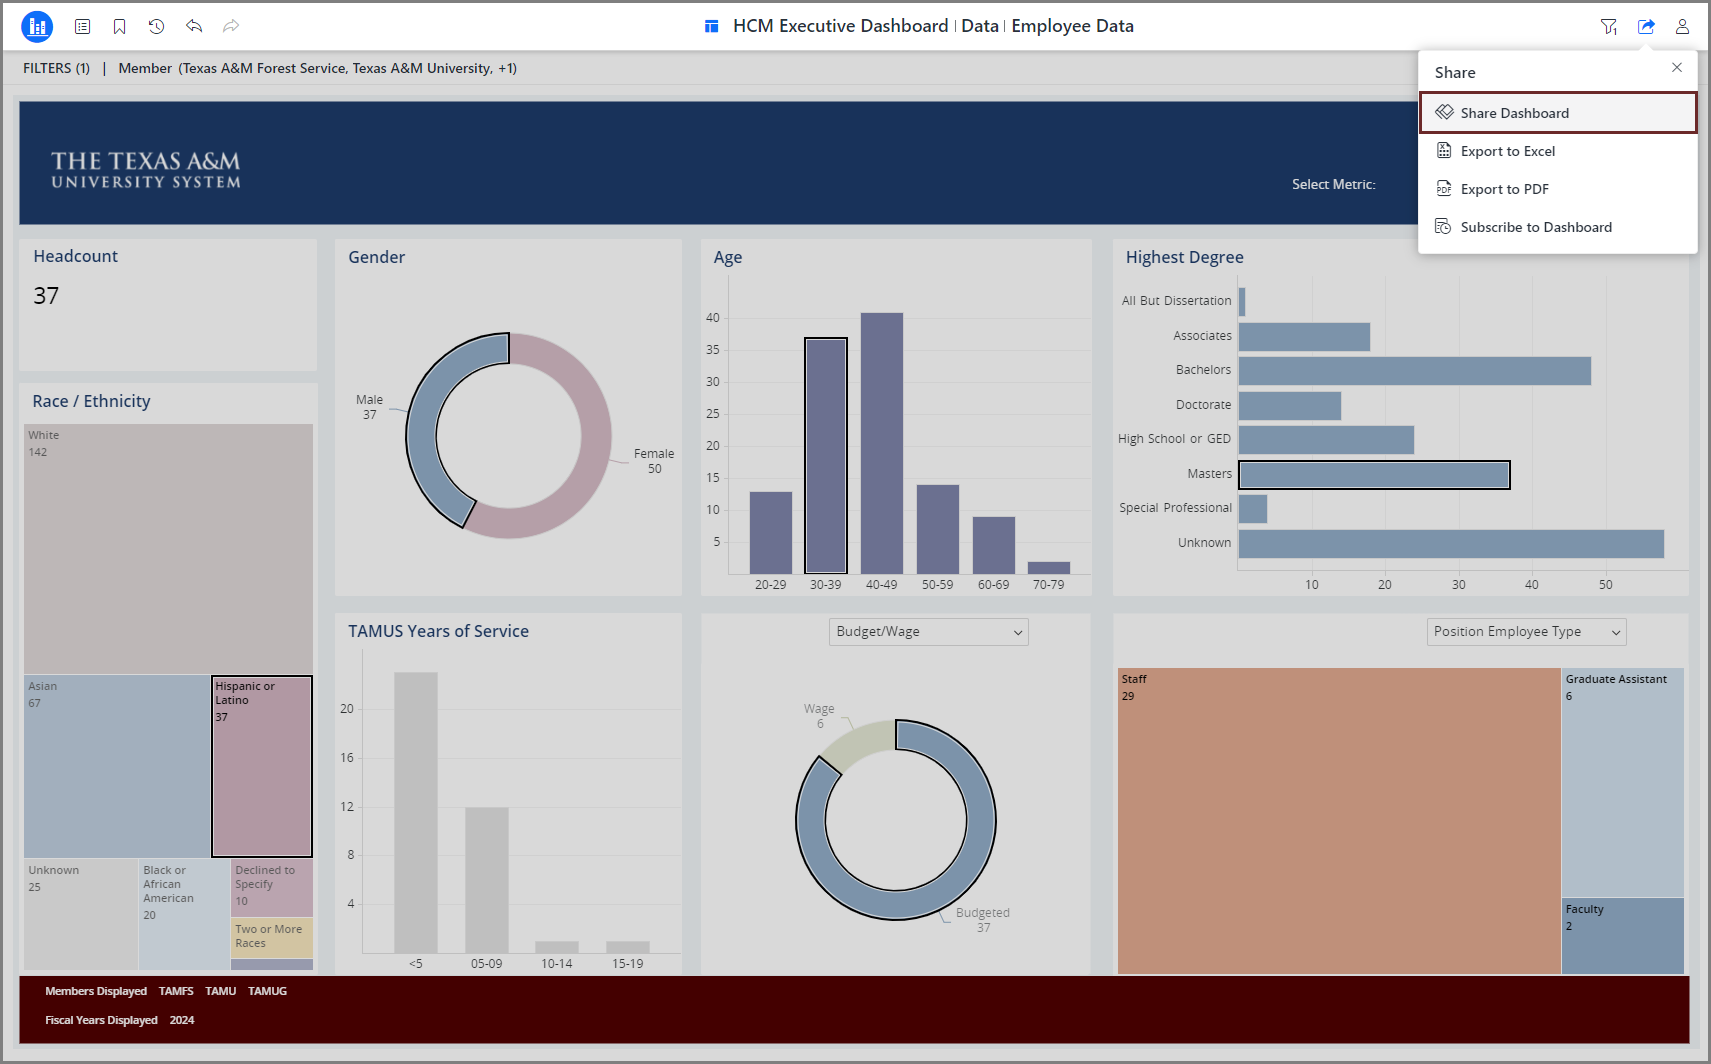
1. Select the Share icon to produce a list of ways to share the dashboard.
2. Select the Share Dashboard.
3. In the Share With field, enter the email addresses of any recipients you would like to have access to the dashboard.
IMPORTANT: If you use Share With to send the dashboard, they will receive an invite to view it. Once the individual(s) selects the link, they will be authenticated through SSO. SSO will assess their security permissions. If they don’t have access to the dashboard, sharing will not give them additional access. Enter a message, if necessary.
4. Select Share button to send.
Export to Excel
When you select Export to Excel, MicroStrategy converts the visual information you’re seeing on the dashboard into a format that makes sense for Excel (grid). This option will allow you to share the entire dashboard or just the information already in the grids.
1. Select the Share icon to produce a list of ways to share the dashboard.
2. Select the Export to Excel. It is best practice to select the Show Filters checkbox before completing the task of export.
3. Select the Export button to convert into an Excel Spreadsheet.
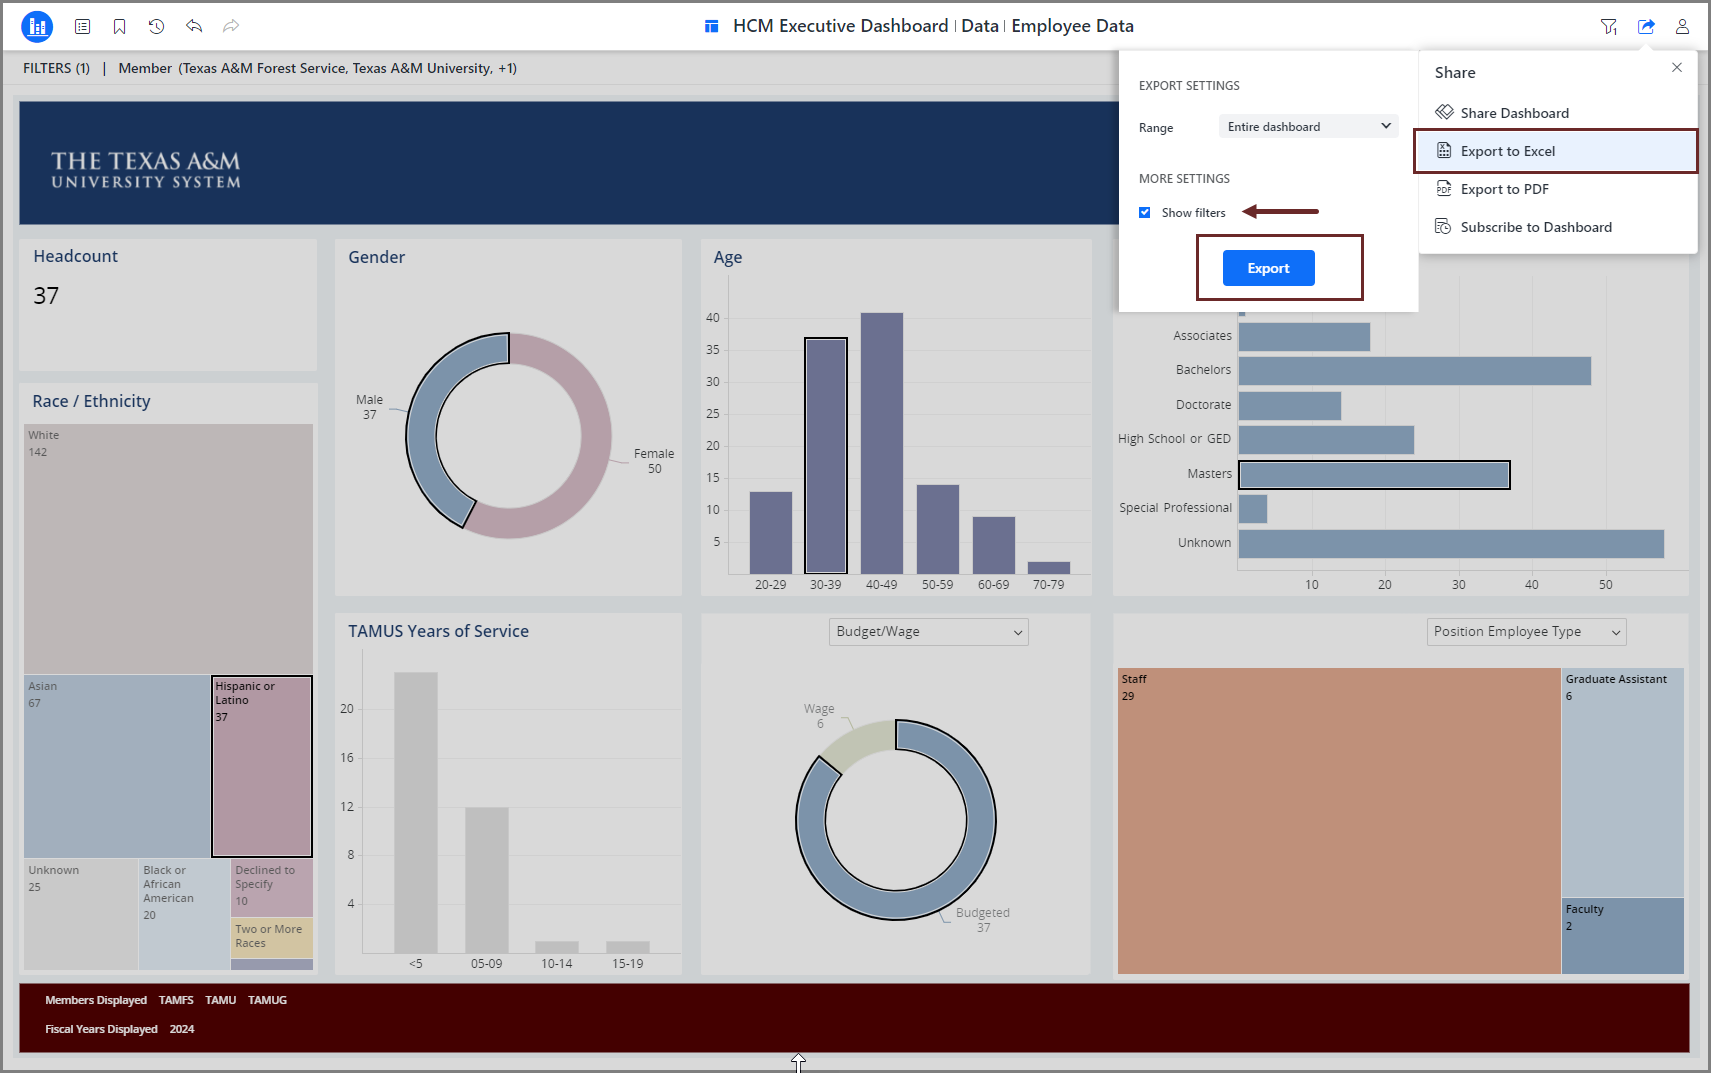
Note: Selecting the option Grids on this page will only export the grid visualizations on the page. Selecting to export the entire dashboard will convert all visualizations to grids.
Export to PDF
Export to PDF allows you to convert the dashboard into a PDF. By selecting this option, you will produce a menu that will allow you to customize the PDF content.
1. Select the Share icon to produce a list of ways to share the dashboard.
2. Select the Export to PDF. It is best practice to select the Legal Paper size to prevent parts of the images and words being cut off from the page.
3. Select the Export button to convert into a PDF Document.
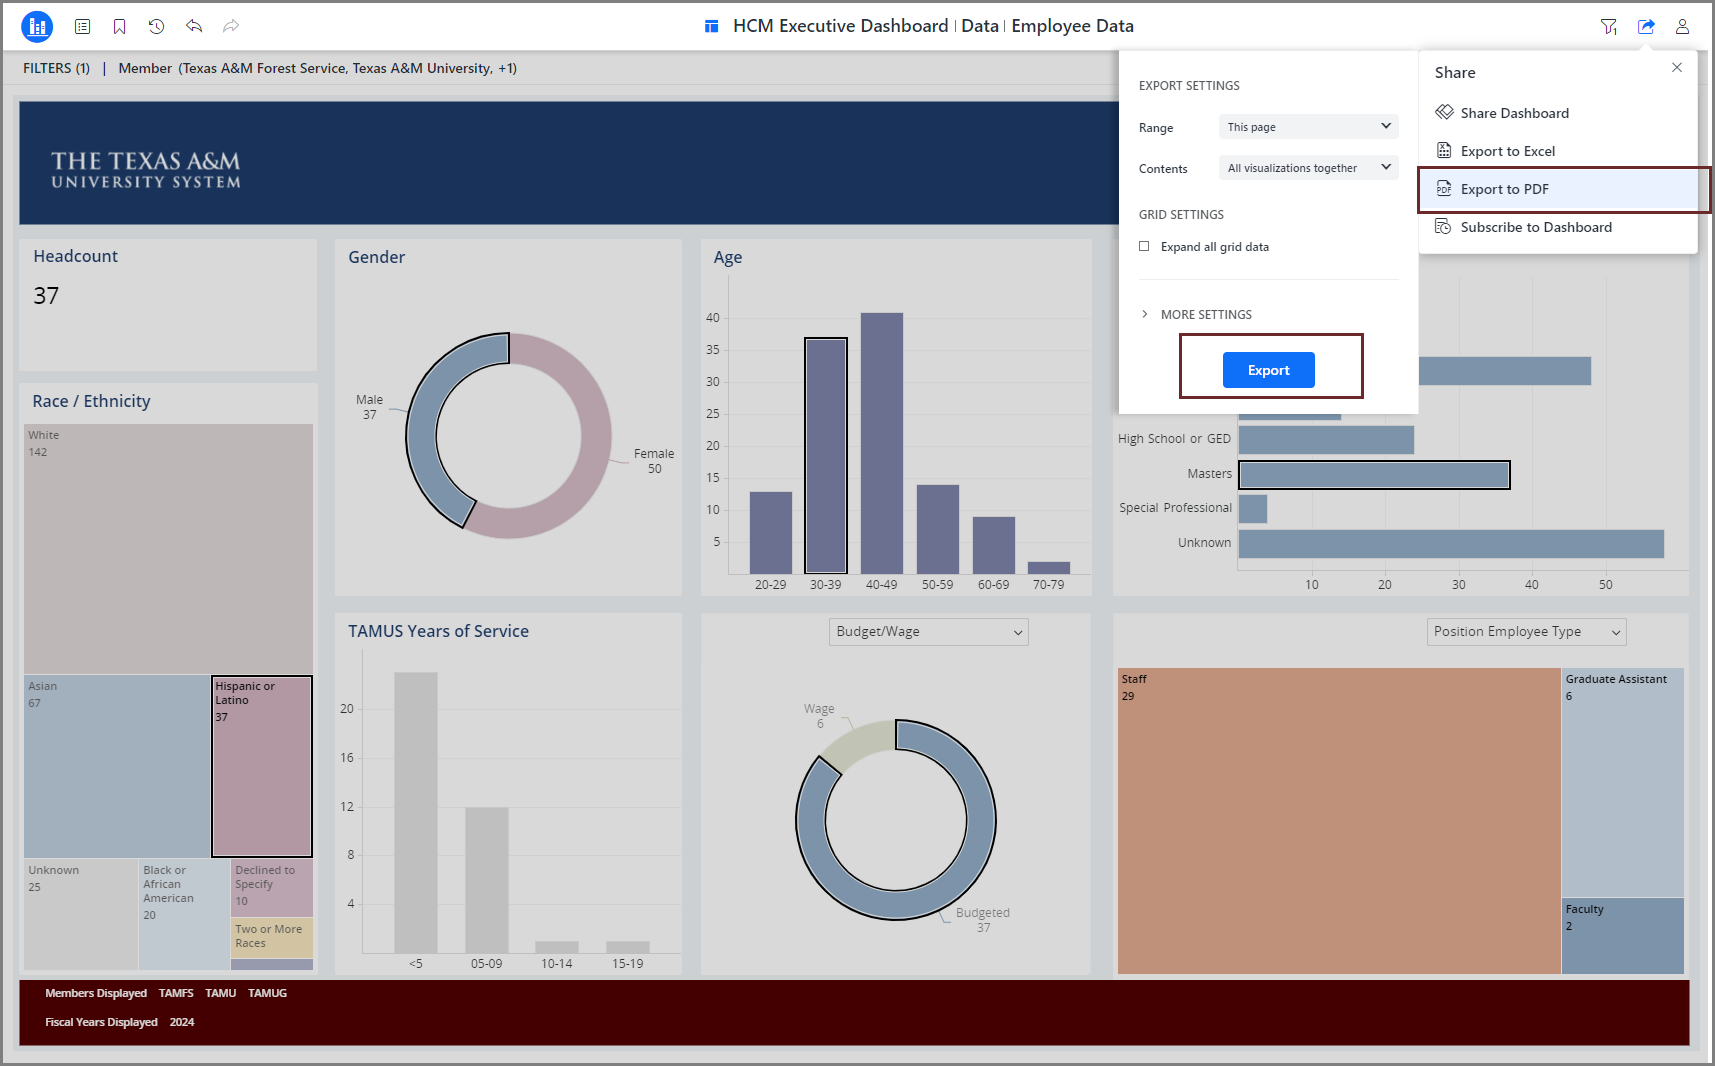
NOTE: The visualizations and formatting will convert into an exported document along with the information in the grids. Dashboard interactivity and selectors will not be available in the PDF document.
Subscribe to Dashboard
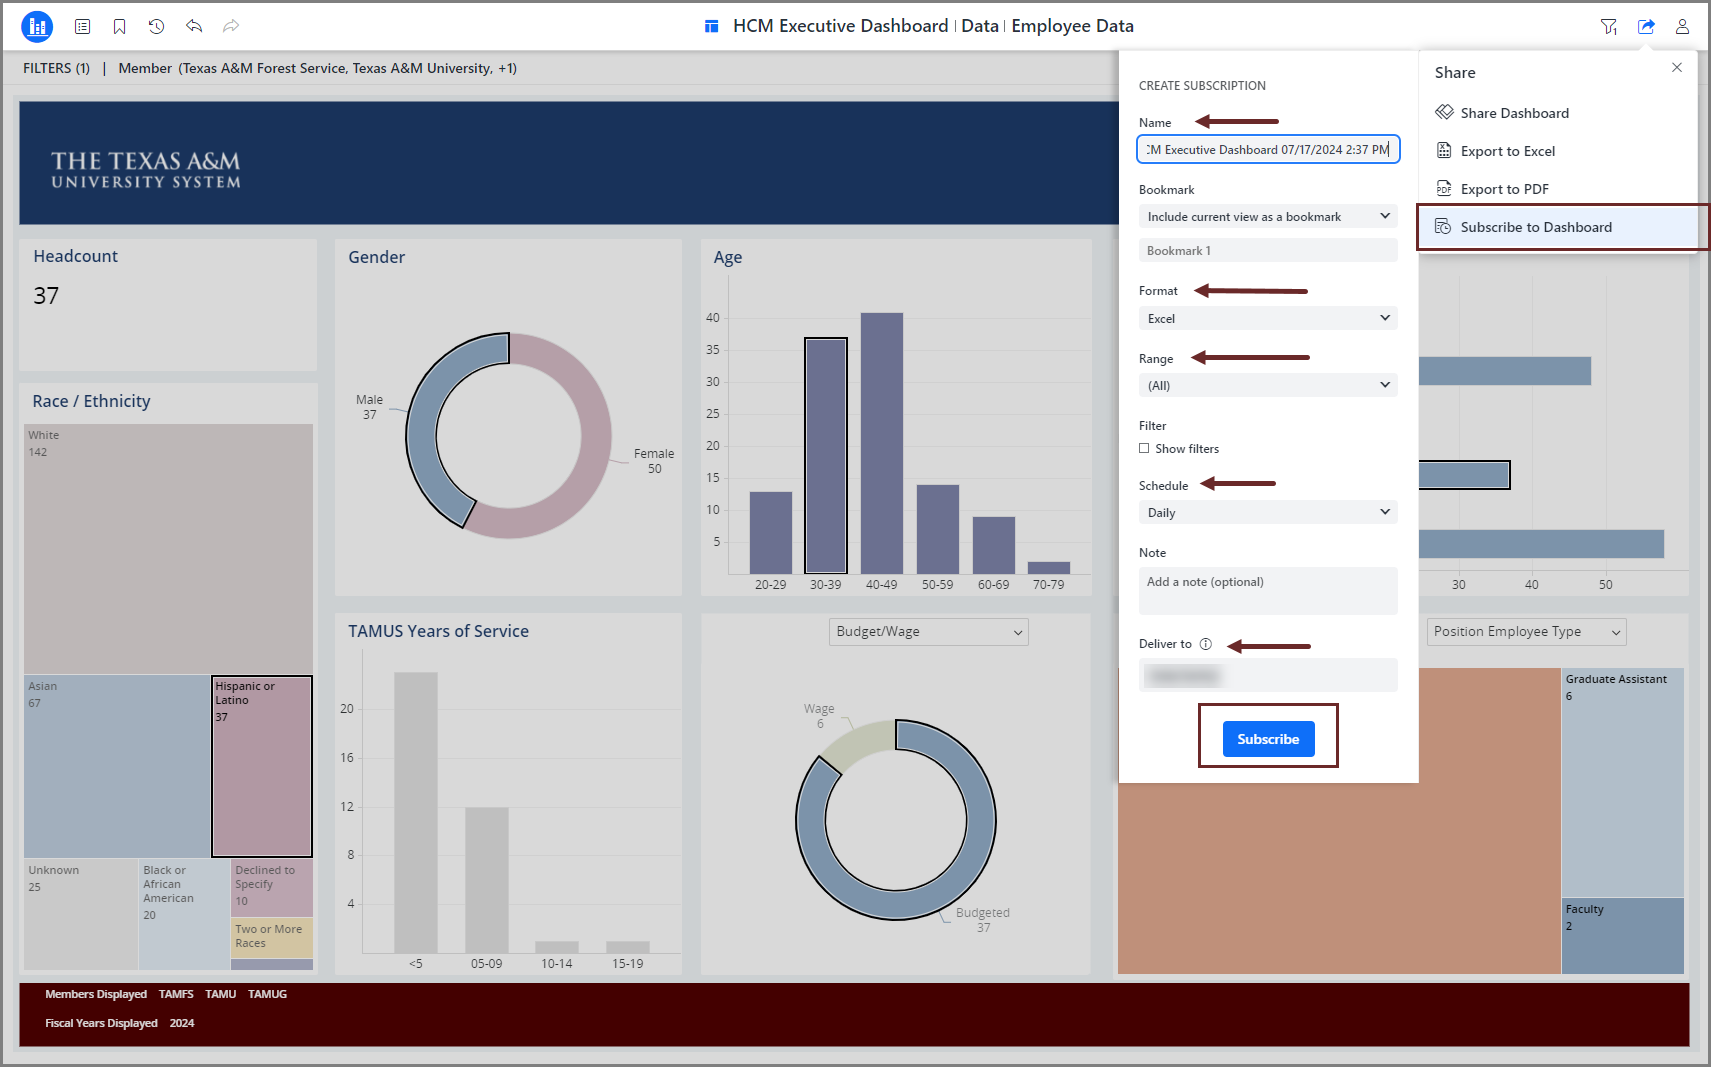
By selecting the option to Subscribe to Dashboard, you are choosing to receive dashboards via email on a scheduled basis. To subscribe to a Dashboard, follow the instructions below:
1. Select the Share icon to produce a list of ways to share the dashboard.
2. Select the Subscribe to Dashboard.
3. Complete the following important fields:
-
-
-
- Name. Enter a descriptive name for the Dashboard. The name should help you determine the information you will review within the Dashboard. The current name, date, and time that you subscribe to the Dashboard will become the Defaulted Name of the subscription.
-
-
-
-
-
- Format. Choose the format of the Dashboard you want to receive. Note: It is best practice to select the Excel option. Excel will be the default format.
-
-
-
-
-
- Range. Select which pages or chapters of the dashboard will appear in the delivered file.
-
-
-
-
-
- Schedule. Choose how frequently you would like the file delivered. The option to receive the subscription Daily will be the defaulted option.
-
-
-
-
-
- Deliver to. Select the names of the recipients you wish to have access to this file via subscription. Your name will be defaulted in the field and cannot be removed.
-
-
Note: You can select the checkbox Send Preview now to all recipients to test how the dashboard will be delivered.
4. Select Subscribe.
Other Tips and Tricks
Expanding or Shrinking Visualizations
To make a visualization larger, hover over it and select the icon with two diagonal arrows pointing outward. This will make the visualization take up the whole page.
To shrink the visualization back down to its original size, hover over the visualization again and select the icon with two diagonal arrows pointing inward.